
Learn how COVID is impacting the financial stability of our community, and what UWECI is doing to help those in need.
The novel coronavirus, COVID-19, is impacting people throughout the world in many ways. Health, social, and educational changes are just a few of the broad aspects of life being altered by the illness. As the global and national economies slow, financial strains are certainly top of mind for individuals who have had working hours reduced or been laid off. Many workers without paid leave or the option to work from home are the very ones living in financially fragile situations and absolutely cannot afford the burdens of either getting sick or going without work.
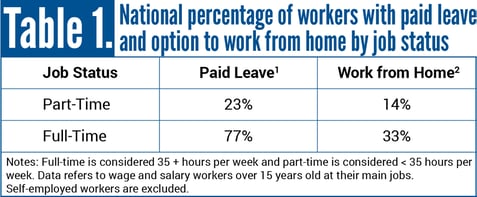
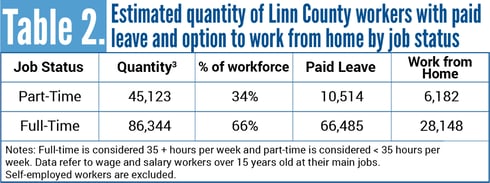
By applying national trends to Linn County, we can estimate the number of workers impacted based on job status and employer benefits. Less than one quarter of all part-time workers, nationally, have paid leave and just one out of seven have the option to work from home. Table 2 indicates that 34% of Linn County’s workforce is made up of part-time labor. Of those, it is estimated that just 10,514 have access to paid leave and 6,182 have the option to work from home. This leaves the vast majority of part-time workers susceptible to getting sick or being laid off, neither of which is affordable to a financially fragile family. In addition, across the nation, a majority of all part-time workers are older and younger adults (over 55 and under 24).[4] It is difficult to estimate the number of households relying on more than one part-time job to make ends meet. These households will be among our most vulnerable.
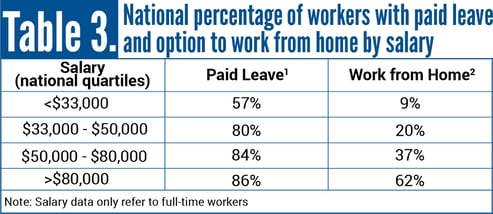
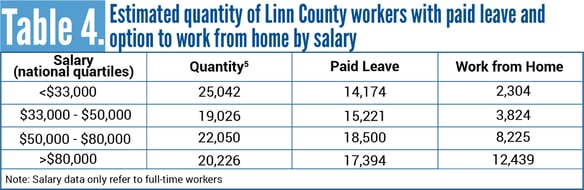
As seen in Table 3, across the nation, barely half of those making under $33,000 per year are offered paid leave and just 9% have the option to work from home. Unfortunately, the quartile earning less than $33,000 per year is Linn County’s largest with 25,042 full-time workers. Consequently, it is estimated that just 2,304 of those workers have the option to work from home. As income increases, so does the availability of paid leave and working from home. While more workers have paid leave than those that don’t at each quartile, the cohort earning over $80,000 is the only one where a majority of individuals have the option to work from home.
United Way of East Central Iowa (UWECI) and its partners are helping those in difficult situations due to COVID-19 in a variety of ways. Aside from our regular function of connecting vulnerable populations in need with services and programs from partner agencies, we are an integral member of Linn Area Partners Active in Disaster (LAP-AID). This group provides vital assistance and creates innovative solutions for needs related to adults of advanced age, childcare, mental health, transportation, and food access. LAP-AID works together with school districts, local governments, and other community leading organizations throughout our region in order to connect volunteers and resources with those in need.
UWECI also created the Community Agency Response Efforts (CARE) Fund. It will be used to address and support the emerging needs of the most vulnerable individuals in our community by funding local nonprofit organizations with increased programs and services due to the virus. These agencies have a proven record of working with UWECI to assist families and provide them with basic food, childcare, and housing needs. You can donate to the fund here. Every dollar counts. Thank you for being champions for the thousands of individuals and families served by UWECI. Our mission and belief in the power of unity are more important today than ever before.

[1] U.S. Bureau of Labor Statistics. American Time Use Survey. (Updated 10/29/19). Table 1.
[2] U.S. Bureau of Labor Statistics. American Time Use Survey. (Updated 11/24/19). Table 2.
[3] U.S. Bureau of Labor Statistics. Quarterly Census Employment and Wages. (2019 3rd Quarter).
[4] U.S. Bureau of Labor Statistics. Current Population Survey. (Updated 1/22/20). Table 22.
[5] U.S. Census Bureau. American Community Survey. 5-Year Estimate. (2018) Table S2001.